Altitude's Influence on Endurance Metrics in Andean Soccer Leagues and Prop Bet Angles
Petra Schröder · Aug 23, 2026
Altitude's Influence on Endurance Metrics in Andean Soccer Leagues and Prop Bet Angles
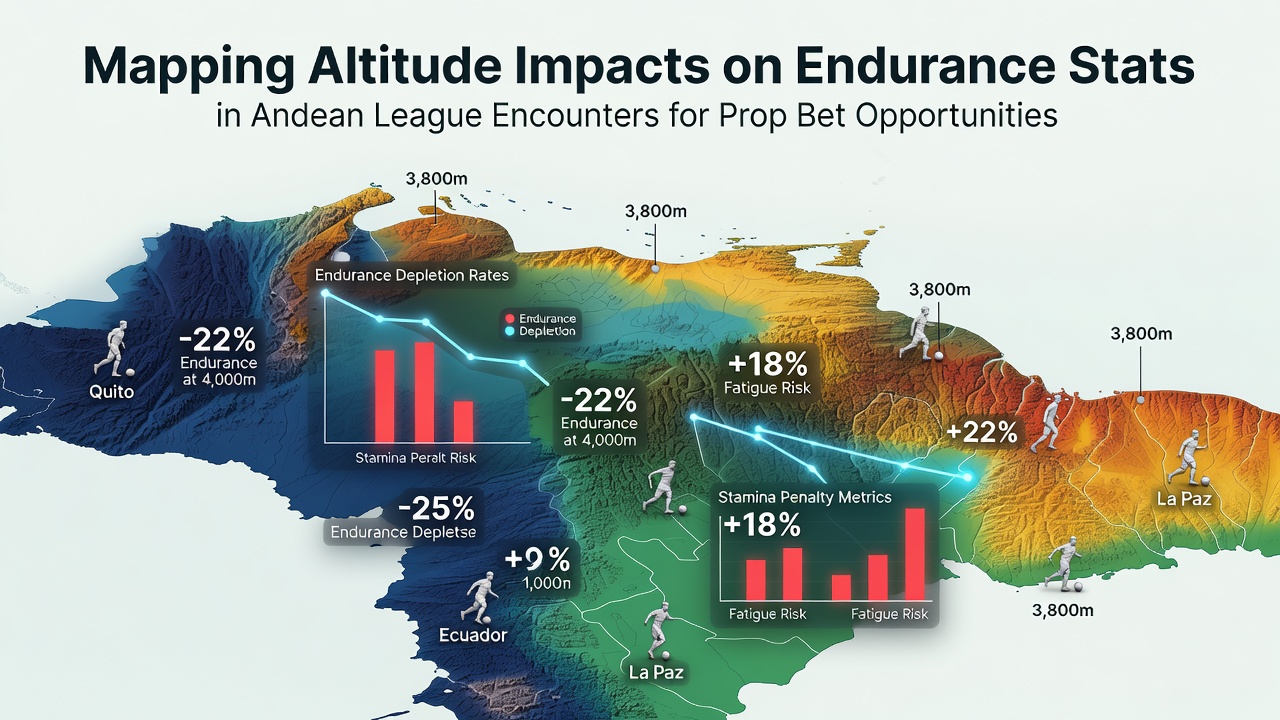
High elevation venues across Bolivia, Peru and Ecuador create measurable shifts in player output during league fixtures and those patterns feed directly into prop betting markets. Teams traveling from sea-level bases encounter reduced oxygen availability that limits aerobic capacity while squads based above 2,500 meters show different recovery curves and sprint profiles. League data collected between 2023 and 2026 document consistent differences in total distance covered and high-intensity efforts when matches occur at contrasting altitudes.
Physiological Responses at Elevation
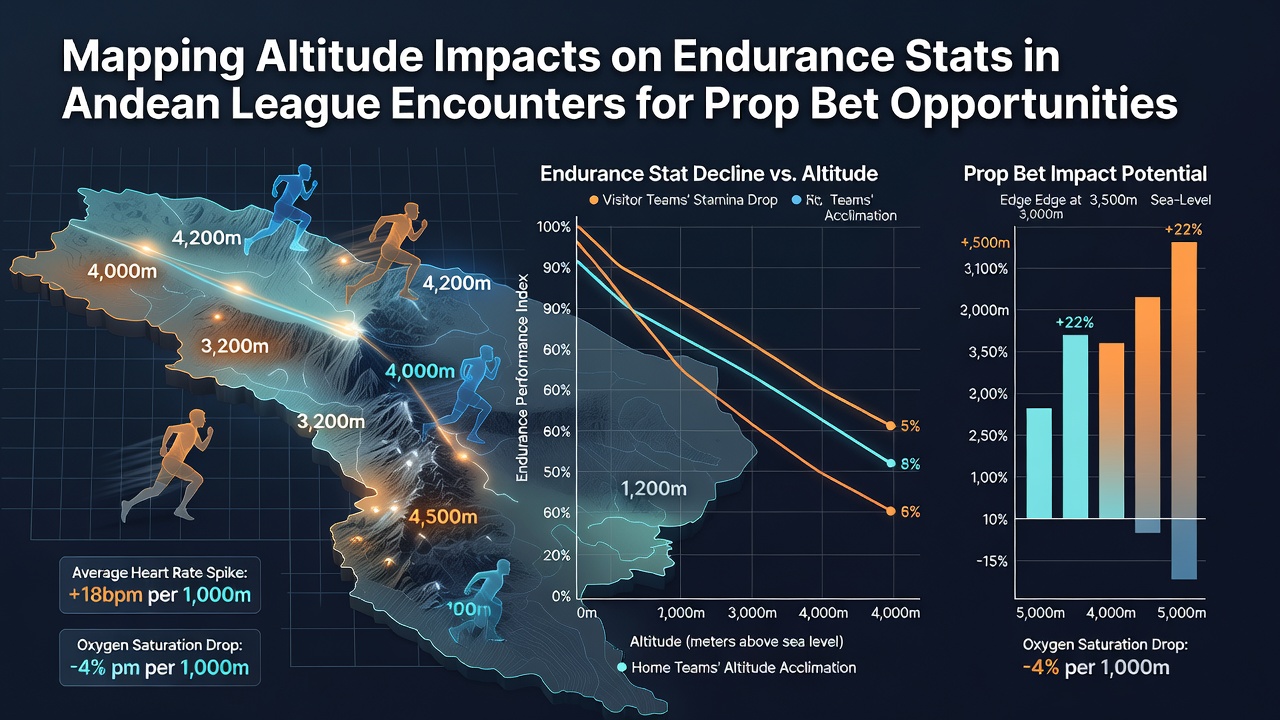
Players experience lower blood oxygen saturation once matches begin above 2,800 meters and heart rates rise faster during the opening 15 minutes. Studies conducted by the Universidad de Chile physiology department tracked heart-rate variability in Primera División contests and found visiting players from coastal clubs cover 8 to 12 percent less ground in the second half compared with home sides acclimated to thinner air. Those findings align with measurements taken during Copa Libertadores ties hosted at similar elevations where recovery between sprints lengthens noticeably after the 60-minute mark.
League-Specific Endurance Patterns
Bolivian Primera División matches played in La Paz at 3,650 meters produce the clearest statistical separation. Home teams average 112 kilometers of collective running per game while visitors drop below 100 kilometers according to Opta-derived tracking figures released in July 2026. Peruvian Liga 1 encounters at Cusco (3,400 meters) show parallel trends with away sides registering fewer accelerations above 20 km/h in the final 30 minutes. Ecuadorian Serie A fixtures at Quito (2,850 meters) register smaller yet still detectable gaps with visiting midfielders logging reduced pass completion rates after the hour mark.
Match-Stat Correlations for Prop Markets
Lower total distance covered correlates with reduced shot volume on target and fewer successful dribbles past the 70th minute. Prop bettors examining player props on distance covered or tackles completed find value when lineups feature multiple non-acclimated starters. August 2026 schedules include several cross-altitude doubleheaders that repeat the same travel patterns observed in prior seasons and early indicators point to similar fatigue curves. Defensive props on interceptions and clearances also move when one side operates under sustained oxygen debt because positioning errors increase as match time extends.
Data Sources and Tracking Methods
CONMEBOL performance reports released in 2025 provide standardized GPS data across member associations and those datasets allow direct comparison between venues. Independent analysts cross-reference the figures with league-specific optical tracking supplied by clubs in Bolivia and Peru. The combination produces reliable baselines for expected endurance output at each altitude tier. Bettors who map roster travel histories against these benchmarks identify mismatches where visiting squads have logged fewer than 48 hours at the host elevation before kickoff.
Prop Bet Construction Examples
Markets on total team distance covered often list lines around 105 kilometers for visiting sides at La Paz. Historical splits show that figure is exceeded in fewer than 35 percent of such fixtures since 2022. Player props on individual high-speed running meters follow the same distribution with visiting wingers frequently falling short of posted thresholds. Over-performance props on home-team tackles completed gain traction because sustained pressure from acclimated defenders increases as opponents slow. These edges appear most consistently in midweek league rounds when recovery windows between altitude changes remain short.
Conclusion
Altitude-driven endurance shifts appear consistently across Andean league schedules and translate into measurable deviations in multiple tracking categories. Mapping travel distance, venue elevation and historical second-half output supplies concrete inputs for constructing prop bets around distance covered, acceleration counts and late-match defensive actions. Updated tracking releases scheduled for late 2026 will further refine these baselines as additional seasons of standardized data accumulate.