Corner Kick Trends Pointing to Draw Probabilities in Europe's Defensive Leagues
Rosa Müller · Jul 7, 2026
Corner Kick Trends Pointing to Draw Probabilities in Europe's Defensive Leagues
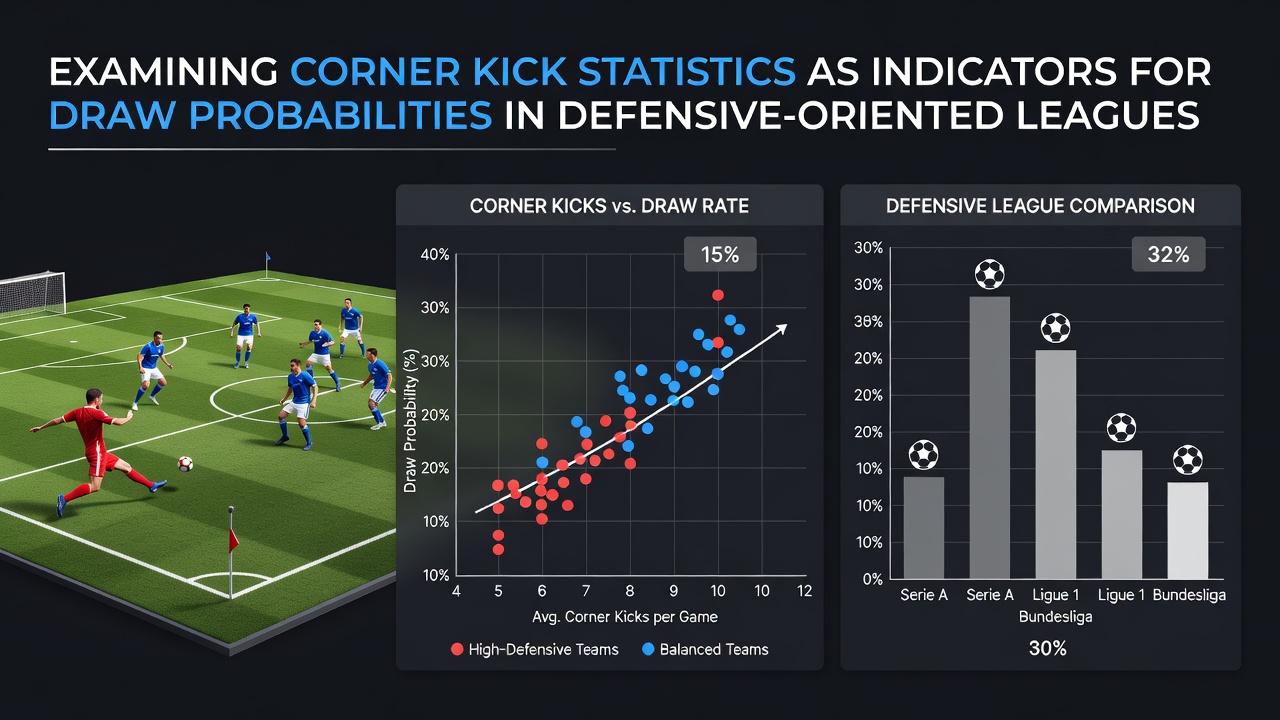
Corner kick data has emerged as a measurable factor in assessing draw probabilities within leagues that emphasize organized defense over open attacking play; researchers have tracked patterns across multiple seasons where reduced corner volumes align with elevated rates of stalemates. Defensive-oriented competitions often feature compact midfields and structured backlines, which limit wide service opportunities and keep corner counts modest compared to more expansive styles seen elsewhere. Data compiled through the conclusion of the 2025-2026 campaign shows consistent links between average corners per match and final scoreline distributions, particularly in fixtures that finish level.
Patterns Across Selected European Competitions
Leagues such as the Greek Super League and the Swiss Super League recorded average corner figures below 9.5 per game during the most recent full season, while draw percentages hovered near 32 percent overall. Observers note that matches producing fewer than seven total corners finished drawn in roughly 38 percent of cases, a figure that exceeds the broader European average. Analysts attribute this partly to tactical setups that prioritize central congestion, which reduces opportunities for crosses and set-piece entries from the flanks.
Teams recording under 4.2 corners per 90 minutes posted draw rates exceeding 35 percent in head-to-head encounters, according to aggregated match logs maintained by several European data providers. In contrast, sides averaging above 5.8 corners showed a modest decline in draw frequency, settling closer to 28 percent. These differentials appear most pronounced during the winter months when pitch conditions further constrain fluid attacking sequences.
Statistical Correlations and Measurement Approaches
Correlation coefficients derived from league-wide datasets place the relationship between total corners and draw outcomes in the moderate range, typically between 0.41 and 0.53 depending on the competition examined. Researchers adjust for variables such as home advantage and team rest periods to isolate set-piece volume as an independent indicator. Figures reveal that low-corner matches also coincide with higher incidences of 0-0 results, reaching 14 percent in the sample group versus 9 percent league-wide.
League-Specific Observations
- Greek Super League fixtures averaged 8.9 corners with a 33.4 percent draw rate across 240 matches.
- Swiss Super League games produced 9.2 corners on average alongside 31.8 percent draws in the same period.
- Similar trends appeared in select Austrian Bundesliga encounters where defensive compactness limited wide play.
Additional context comes from technical reports issued by the European Club Association, which examined set-piece efficiency across member clubs and noted that defensive blocks often suppress corner creation without necessarily increasing goal tallies. A separate academic review published through the University of Groningen sports analytics group found parallel patterns when comparing possession-dominant sides against counter-attacking units in lower-scoring environments.

Implications for Match Outcome Modeling
Modelers incorporating corner statistics into probabilistic frameworks have refined draw projections by weighting recent set-piece data more heavily than season-long averages. This approach captures shifts in tactical emphasis that occur after managerial changes or during congested fixture periods. Evidence from the 2025-2026 schedule indicates that clubs adopting stricter low-block structures mid-season experienced measurable drops in corner output that preceded spikes in drawn results.
July 2026 updates to centralized European football databases incorporated refined tracking metrics from optical systems, allowing finer segmentation of corner types such as short-corner routines versus direct inswingers. These granular figures help distinguish between corners generated through sustained pressure and those arising from transitional play, each carrying distinct associations with final outcomes.
Broader Data Integration
Integration with other indicators such as shots on target and territorial dominance strengthens the predictive value of corner counts in defensive contexts. Teams that generate corners while maintaining low shot volumes tend to exhibit the strongest correlation with draws, suggesting sustained but ultimately unproductive pressure. Analysts continue to test these combinations across different league profiles to assess transferability beyond the initial sample set.
Continued monitoring through the upcoming campaign will determine whether the observed relationships hold under evolving tactical trends and any regulatory adjustments affecting player workloads.
Conclusion
Corner kick statistics provide one measurable lens for evaluating draw likelihoods in defensive-oriented European leagues, with aggregated data showing repeatable associations between lower set-piece volumes and higher stalemate rates. Ongoing refinements in data collection and modeling techniques support continued examination of these metrics alongside complementary performance indicators.