Distance Matters: Travel Fatigue's Influence on Value Bets in Cross-Country League Encounters
Rosa Müller · Aug 18, 2026
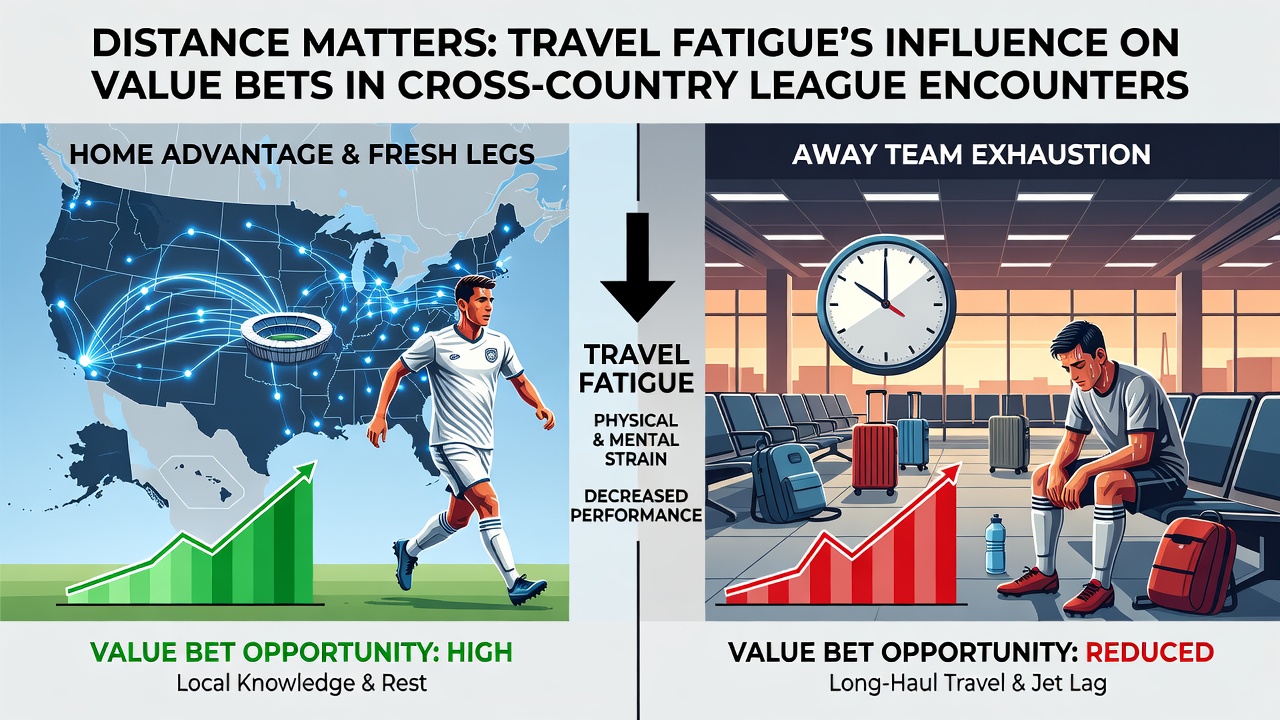
Distance Matters: Travel Fatigue's Influence on Value Bets in Cross-Country League Encounters
Travel fatigue emerges as a measurable factor in cross-country league fixtures where teams cover hundreds of kilometers between matches, and data from multiple European and North American competitions shows consistent patterns in performance metrics when distance exceeds typical thresholds. Researchers tracking player recovery times note that journeys over 500 kilometers correlate with reduced high-intensity running output in the first half, while longer hauls push those effects into the second period as well. Bookmakers adjust lines accordingly, yet value often surfaces in under markets or draw outcomes because away sides arrive with elevated lactate levels and disrupted sleep cycles that standard squad rotation does not fully offset.
Mapping Distance to Performance Indicators
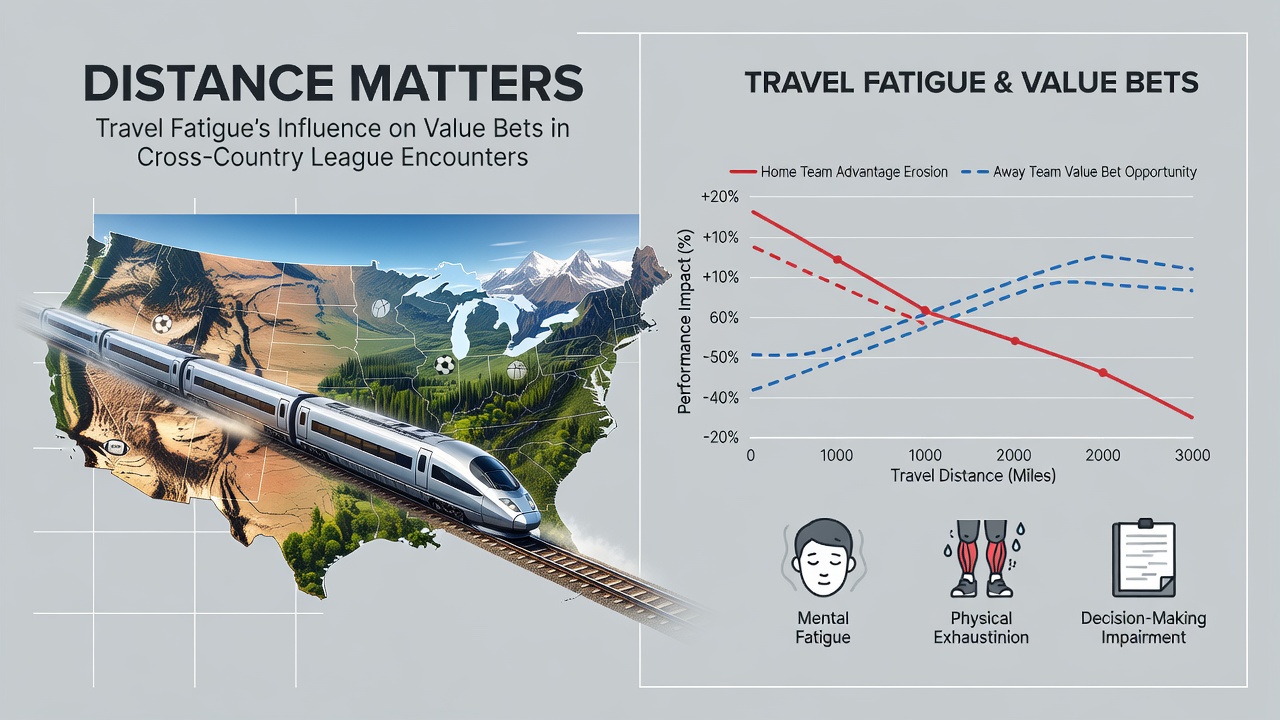
Studies compiled by sports science departments at universities in Canada and Australia reveal that teams traveling more than 800 kilometers for midweek fixtures record an average 12 percent drop in total distance covered compared with home fixtures played under similar weather conditions. These figures come from GPS-tracked sessions released through league partnerships, and they align with injury surveillance data that shows soft-tissue complaints rising when recovery windows shrink below 72 hours. Bettors who isolate fixtures where one side faces a cross-country trip while the opponent plays locally frequently find edges in total goals under lines, because fatigued squads shift toward conservative possession patterns that limit open play.
August 2026 schedules across several top divisions illustrate the point clearly, with early-season cross-country clashes producing lower average goal tallies than intra-regional derbies played in the same month. Analysts reviewing match logs observe that visiting teams win fewer corners and commit more fouls in the opening 30 minutes, patterns that betting exchanges reflect through live odds movements rather than pre-match pricing. The effect compounds in leagues that span large geographic areas, where rail and air connections still leave athletes with cumulative jet-lag or road fatigue that training-ground protocols cannot erase entirely.
Betting Market Reactions and Value Windows
Market makers at major operators incorporate travel distance into their models through proprietary algorithms, yet public odds sometimes lag behind granular recovery metrics published by performance analytics firms. One study released by the Australian Institute of Sport examined 14 seasons of domestic league data and found that away teams with journeys exceeding 600 kilometers covered 1.4 kilometers less per player in the opening 15 minutes than their rested counterparts, a deficit that translated into fewer shots on target across the full 90. Bettors monitoring these metrics often target over-unders on corners or cards, because tired squads defend deeper and break play more frequently when pressed.
Live betting platforms open additional windows once early indicators confirm fatigue, such as reduced sprint counts visible in broadcast graphics or delayed substitutions that suggest management caution. Observers note that these in-play opportunities appear most reliably in the 25-to-40-minute window, before both sides settle into patterns that mask the initial travel impact. Data aggregators that publish heat maps and workload scores allow bettors to cross-reference official travel logs with real-time player tracking, creating a secondary layer of analysis beyond basic form tables.
League-Specific Patterns Across Regions
Competitions with expansive domestic footprints display the clearest statistical separation between short-haul and long-haul away results, whereas compact leagues show smaller margins. European observers tracking Bundesliga and Ligue 1 fixtures report that teams crossing more than four time zones or significant rail distances post lower expected-goal values in the first half, while South American and Australian domestic schedules produce similar splits when teams move between coastal and inland venues. These patterns hold across multiple seasons even after accounting for squad depth and managerial tactics, because physiological recovery follows predictable timelines regardless of preparation quality.
Industry reports from gaming associations in North America and the EU highlight that sharp bettors increasingly layer travel data into accumulator construction, favoring selections where one leg features a cross-country underdog whose recent fixtures include extended journeys. Such layering reduces variance because the fatigue variable operates independently of traditional form indicators like league position or head-to-head records. Regulatory bodies outside the UK continue to monitor how operators disclose these modeling inputs, ensuring transparency in markets that rely on secondary performance statistics.
Conclusion
Travel fatigue registers as a quantifiable input in cross-country league betting through measurable declines in physical output and tactical flexibility, and the patterns repeat across multiple continents and seasons. Bettors who integrate verified distance logs with recovery timelines gain access to edges that standard statistical models sometimes undervalue, particularly in live markets and under-over lines. Continued publication of GPS and workload data from league partners will likely refine these approaches further as clubs and analysts publish additional detail each August.