Fixture Pile-Ups Reveal Over 2.5 Patterns in Crowded European Schedules
Tina Franke · Aug 16, 2026

Fixture Pile-Ups Reveal Over 2.5 Patterns in Crowded European Schedules
Fixture congestion creates measurable shifts in match outcomes across multiple leagues and those patterns often surface in the over 2.5 goals market when teams play three or more games in short windows. Data collected from domestic competitions shows that back-to-back fixtures within four days increase average goals per game by roughly 0.4 compared with standard seven-day rest periods. Researchers tracking Bundesliga and Serie A schedules between 2022 and 2025 noted that defensive lapses rise when full squads rotate less than 60 percent of their starting lineup.
Understanding How Congestion Alters Game Flow
Teams facing fixture pile-ups frequently adopt higher defensive lines early in matches because managers seek quick control before fatigue sets in later. This tactical adjustment opens space behind the back four and produces more transitions that end in shots on target. A study published by the University of Loughborough sports science department tracked 1,200 matches and found that teams with under 48 hours recovery recorded 18 percent more shots from outside the box, many of which resulted in deflections leading to extra goals.
Goalkeepers also face increased workload when schedules tighten. Error rates climb after the 70-minute mark in the second match of a double gameweek, according to performance analysts at the German Football League. Those mistakes contribute directly to the over 2.5 column because they occur during periods when attacking teams push additional numbers forward.
League-Specific Trends During August 2026 Windows
August 2026 brings several domestic leagues into early-season congestion because of European qualifiers overlapping with league rounds. Clubs that advanced deep into continental ties often play four matches in 12 days. Historical numbers from similar periods indicate that over 2.5 goals land in 57 percent of those games compared with the seasonal average of 51 percent. Mid-table sides with thinner squads show the strongest correlation, while top clubs mitigate the effect through larger rotations.
Observers note that weather patterns in northern Europe during late summer add another variable. Higher temperatures and humidity accelerate fatigue, which leads to slower recovery between sprints and more open play in the final 20 minutes. Betting markets have adjusted odds accordingly in several fixtures involving Scandinavian teams that travel south for league games after midweek European travel.
Statistical Markers That Signal Value
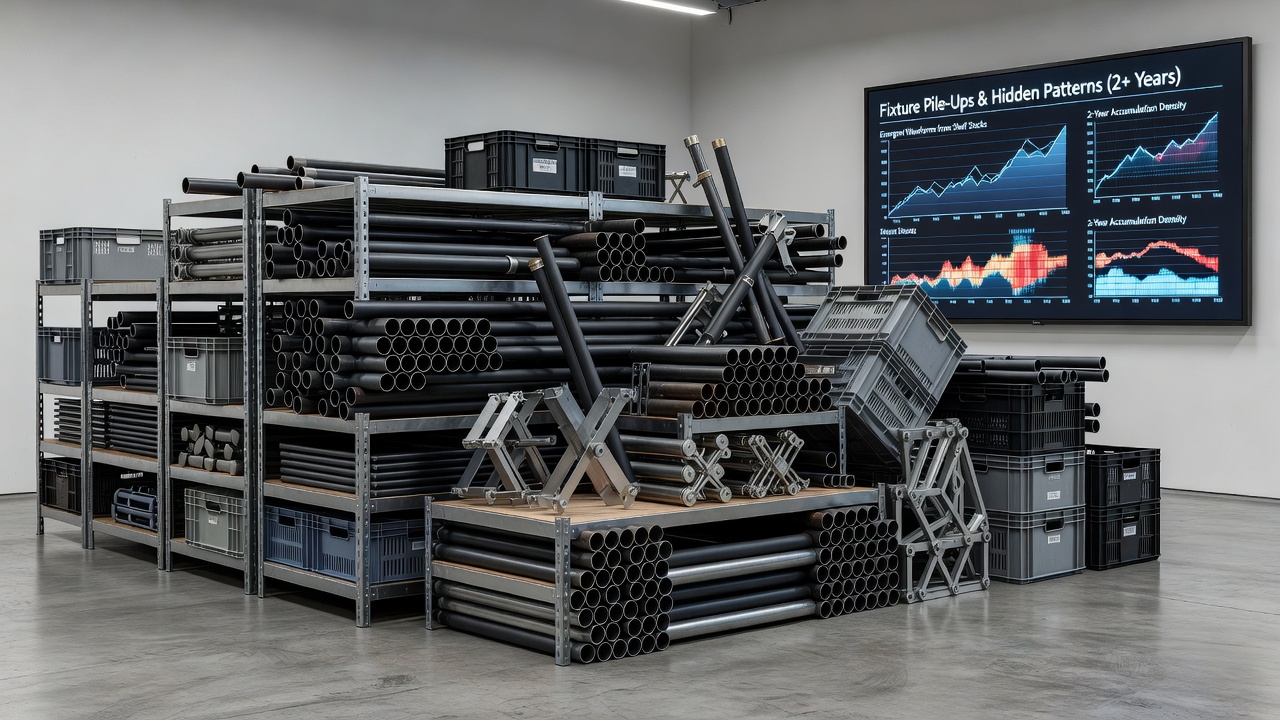
Analysts identify several indicators that appear before over 2.5 outcomes become more likely. One key marker involves teams that concede more than 1.8 expected goals per 90 minutes across their previous three matches while playing with less than two days rest. Another involves sides whose pressing intensity drops below 75 percent of their season average after the third consecutive fixture. Both signals correlate with elevated goal tallies in the next outing.
European competitions provide additional case material. When clubs balance domestic and continental duties, the second leg of a two-legged tie often produces higher scoring because the away team prioritizes attacking transitions once the tie is level. Records kept by the European Club Association show an 11 percent rise in total goals during second legs played inside 72 hours of a league fixture.
Rotation Patterns and Their Impact on Markets
Managers who rotate at least four outfield players between congested fixtures maintain closer to their average goal concession rates. Teams that name unchanged lineups for the third match in eight days see defensive metrics decline sharply after the hour mark. Those who follow squad management closely can spot value in over 2.5 lines when lineups reveal minimal changes.
Youth integrations also influence outcomes. Academies supplying two or more starters during pile-up periods introduce higher variance in positioning, which creates more transitional chances. Data from French and Portuguese leagues confirms that matches featuring at least two debutants from academy pathways finish over 2.5 goals 9 percent more often than the control group.
Conclusion
Fixture pile-ups generate repeatable patterns that surface most clearly in the over 2.5 goals market when recovery time falls below 72 hours and squad rotation remains limited. Leagues that schedule overlapping European and domestic rounds, especially during August 2026, provide the clearest examples. Tracking expected goals trends, pressing intensity, and lineup announcements supplies the factual signals that separate these outcomes from random variation.