Tracing Travel Fatigue Metrics: How Distance and Schedule Density Shape Away Performance Edges in Continental Leagues
Rosa Müller · Jun 14, 2026
Tracing Travel Fatigue Metrics: How Distance and Schedule Density Shape Away Performance Edges in Continental Leagues
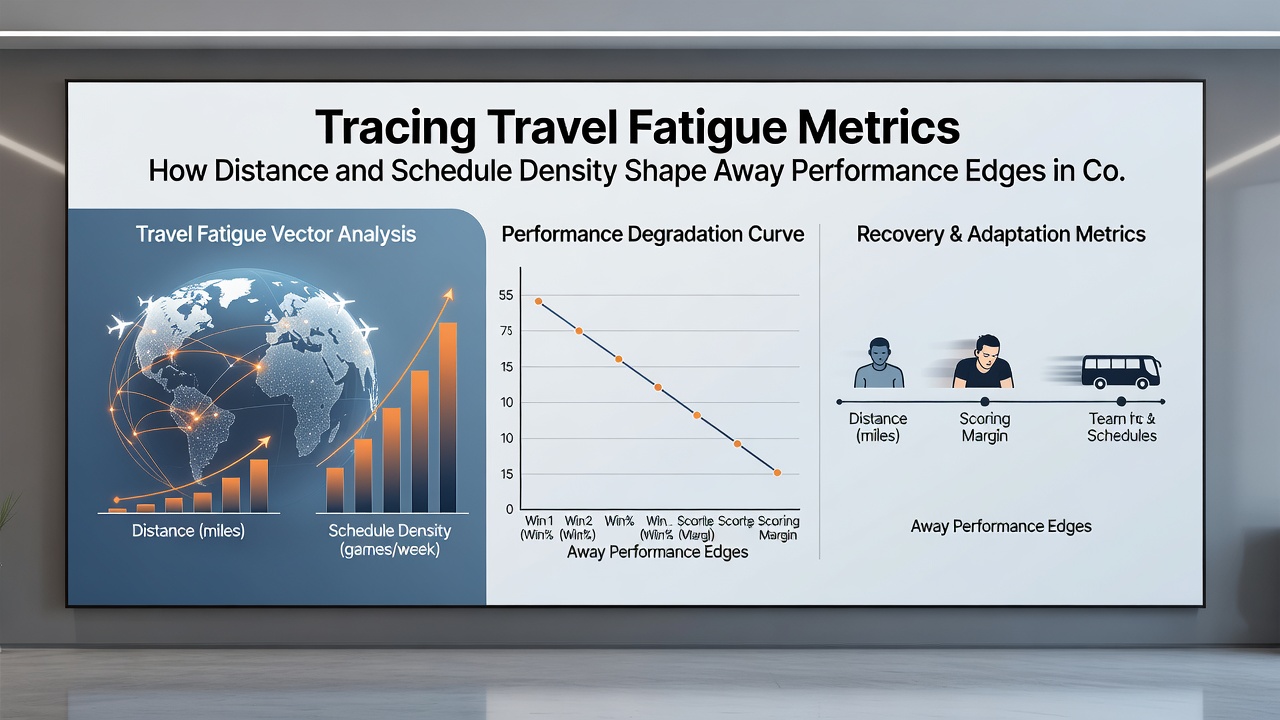
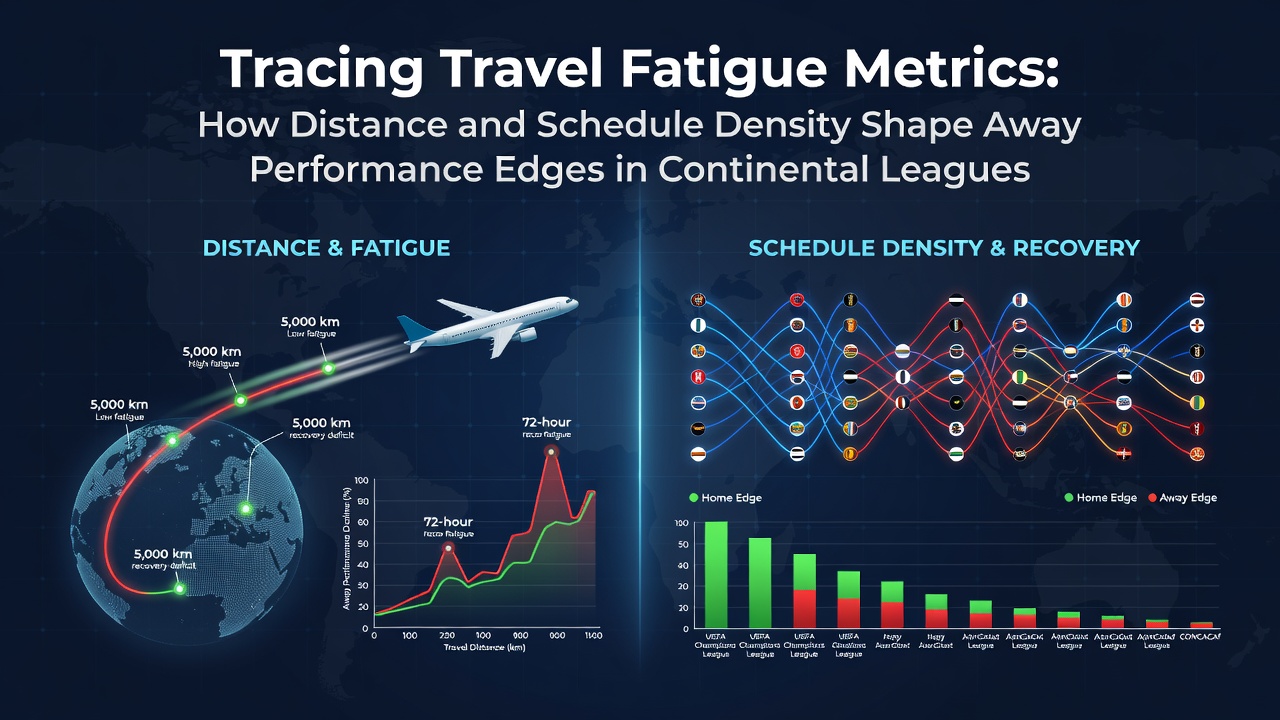
Travel fatigue metrics have gained attention across continental leagues because distance covered between fixtures combined with schedule density directly influences away team outcomes. Researchers track total kilometers traveled, time zone shifts, and the number of matches played within short windows to quantify how these factors alter performance edges. Data collected from multiple seasons shows that squads logging over 1,200 kilometers in a seven-day period experience measurable drops in high-intensity running output during away fixtures, while those facing denser schedules encounter increased injury rates that compound the challenge. Analysts break schedule density into distinct layers: consecutive away games separated by less than 72 hours, midweek continental ties followed by domestic league matches, and extended road trips spanning multiple countries. Each layer adds cumulative strain, yet the interaction between raw distance and fixture clustering produces the clearest statistical patterns. Teams operating in leagues such as the Bundesliga or Serie A record lower expected goal differentials on the road when both metrics exceed established thresholds, according to performance databases maintained by European sports science groups.Distance as a Primary Variable
Geographic spread within continental competitions creates uneven travel burdens. Clubs based in peripheral cities routinely cover greater distances than those clustered near central hubs, and longitudinal studies confirm that away sides traveling beyond 800 kilometers show reduced possession retention in the opening 30 minutes of matches. GPS tracking systems deployed across top divisions capture these effects in real time, revealing slower acceleration profiles and fewer successful presses when recovery windows shrink. What's interesting is the way distance compounds with other variables. A single long-haul trip rarely decides results on its own, yet repeated journeys within a month correlate with elevated error rates in passing accuracy and set-piece defending. Observers note that clubs employing dedicated recovery protocols, including chartered flights and on-site physiotherapists, mitigate some losses, while smaller squads without comparable resources absorb larger performance decrements.Schedule Density Patterns and Performance Data
Schedule density exerts influence through consecutive high-load days rather than isolated fixtures. Leagues that pack three matches into ten days generate clusters where away results diverge sharply from home baselines. Figures from the 2024-2025 campaign indicate that teams contesting continental ties midweek followed by domestic away games posted win percentages 14 points lower than their season averages. The pattern holds across several competitions because sleep disruption and muscle inflammation accumulate faster than standard rest periods can address. One study revealed that fixture congestion exceeding four matches in 14 days correlates with a 9 percent rise in soft-tissue injuries among away squads. Those who've studied this know the effect appears most pronounced in defensive units that log higher total distances during pressing phases. Data indicates that schedule density also shifts tactical choices, with coaches often adopting deeper blocks to conserve energy rather than sustaining high press triggers on the road.